Large-Cap vs Small-Cap: Why ‘Quality’ Matters in 2026
This article Large cap vs Small cap is for general financial education only and does not constitute personalized investment advice. All case studies and portfolio illustrations are hypothetical examples of risk management concepts, not promises of future performance. Please consult a SEBI-registered investment adviser before making any investment decisions.
The Numbers That Define This Moment
|
Indicator |
Value |
Source |
Status |
|---|---|---|---|
|
Crude Oil (Indian Basket) |
$115 / barrel |
Vajiram & Ravi, May 2026 |
Confirmed |
|
Rupee vs USD |
Crossed ₹96 (historic low) |
FMT, May 2026 |
Confirmed |
|
FII Outflows from India |
> $20 Billion |
Reuters / FMT, May 2026 |
Confirmed |
|
Flexi-Cap Fund Inflows |
₹10,147 Crore (April 2026) |
AMFI, May 2026 |
Confirmed |
|
Small-Cap Stress Liquidation |
26 to 70 days for 50% of portfolio |
Kunvarji Wealth, Jan 2026 |
Confirmed |
|
Current Account Deficit |
Projected > 2% of GDP |
Bank of America / FMT, May 2026 |
Estimated |
When Markets Catch Pneumonia?
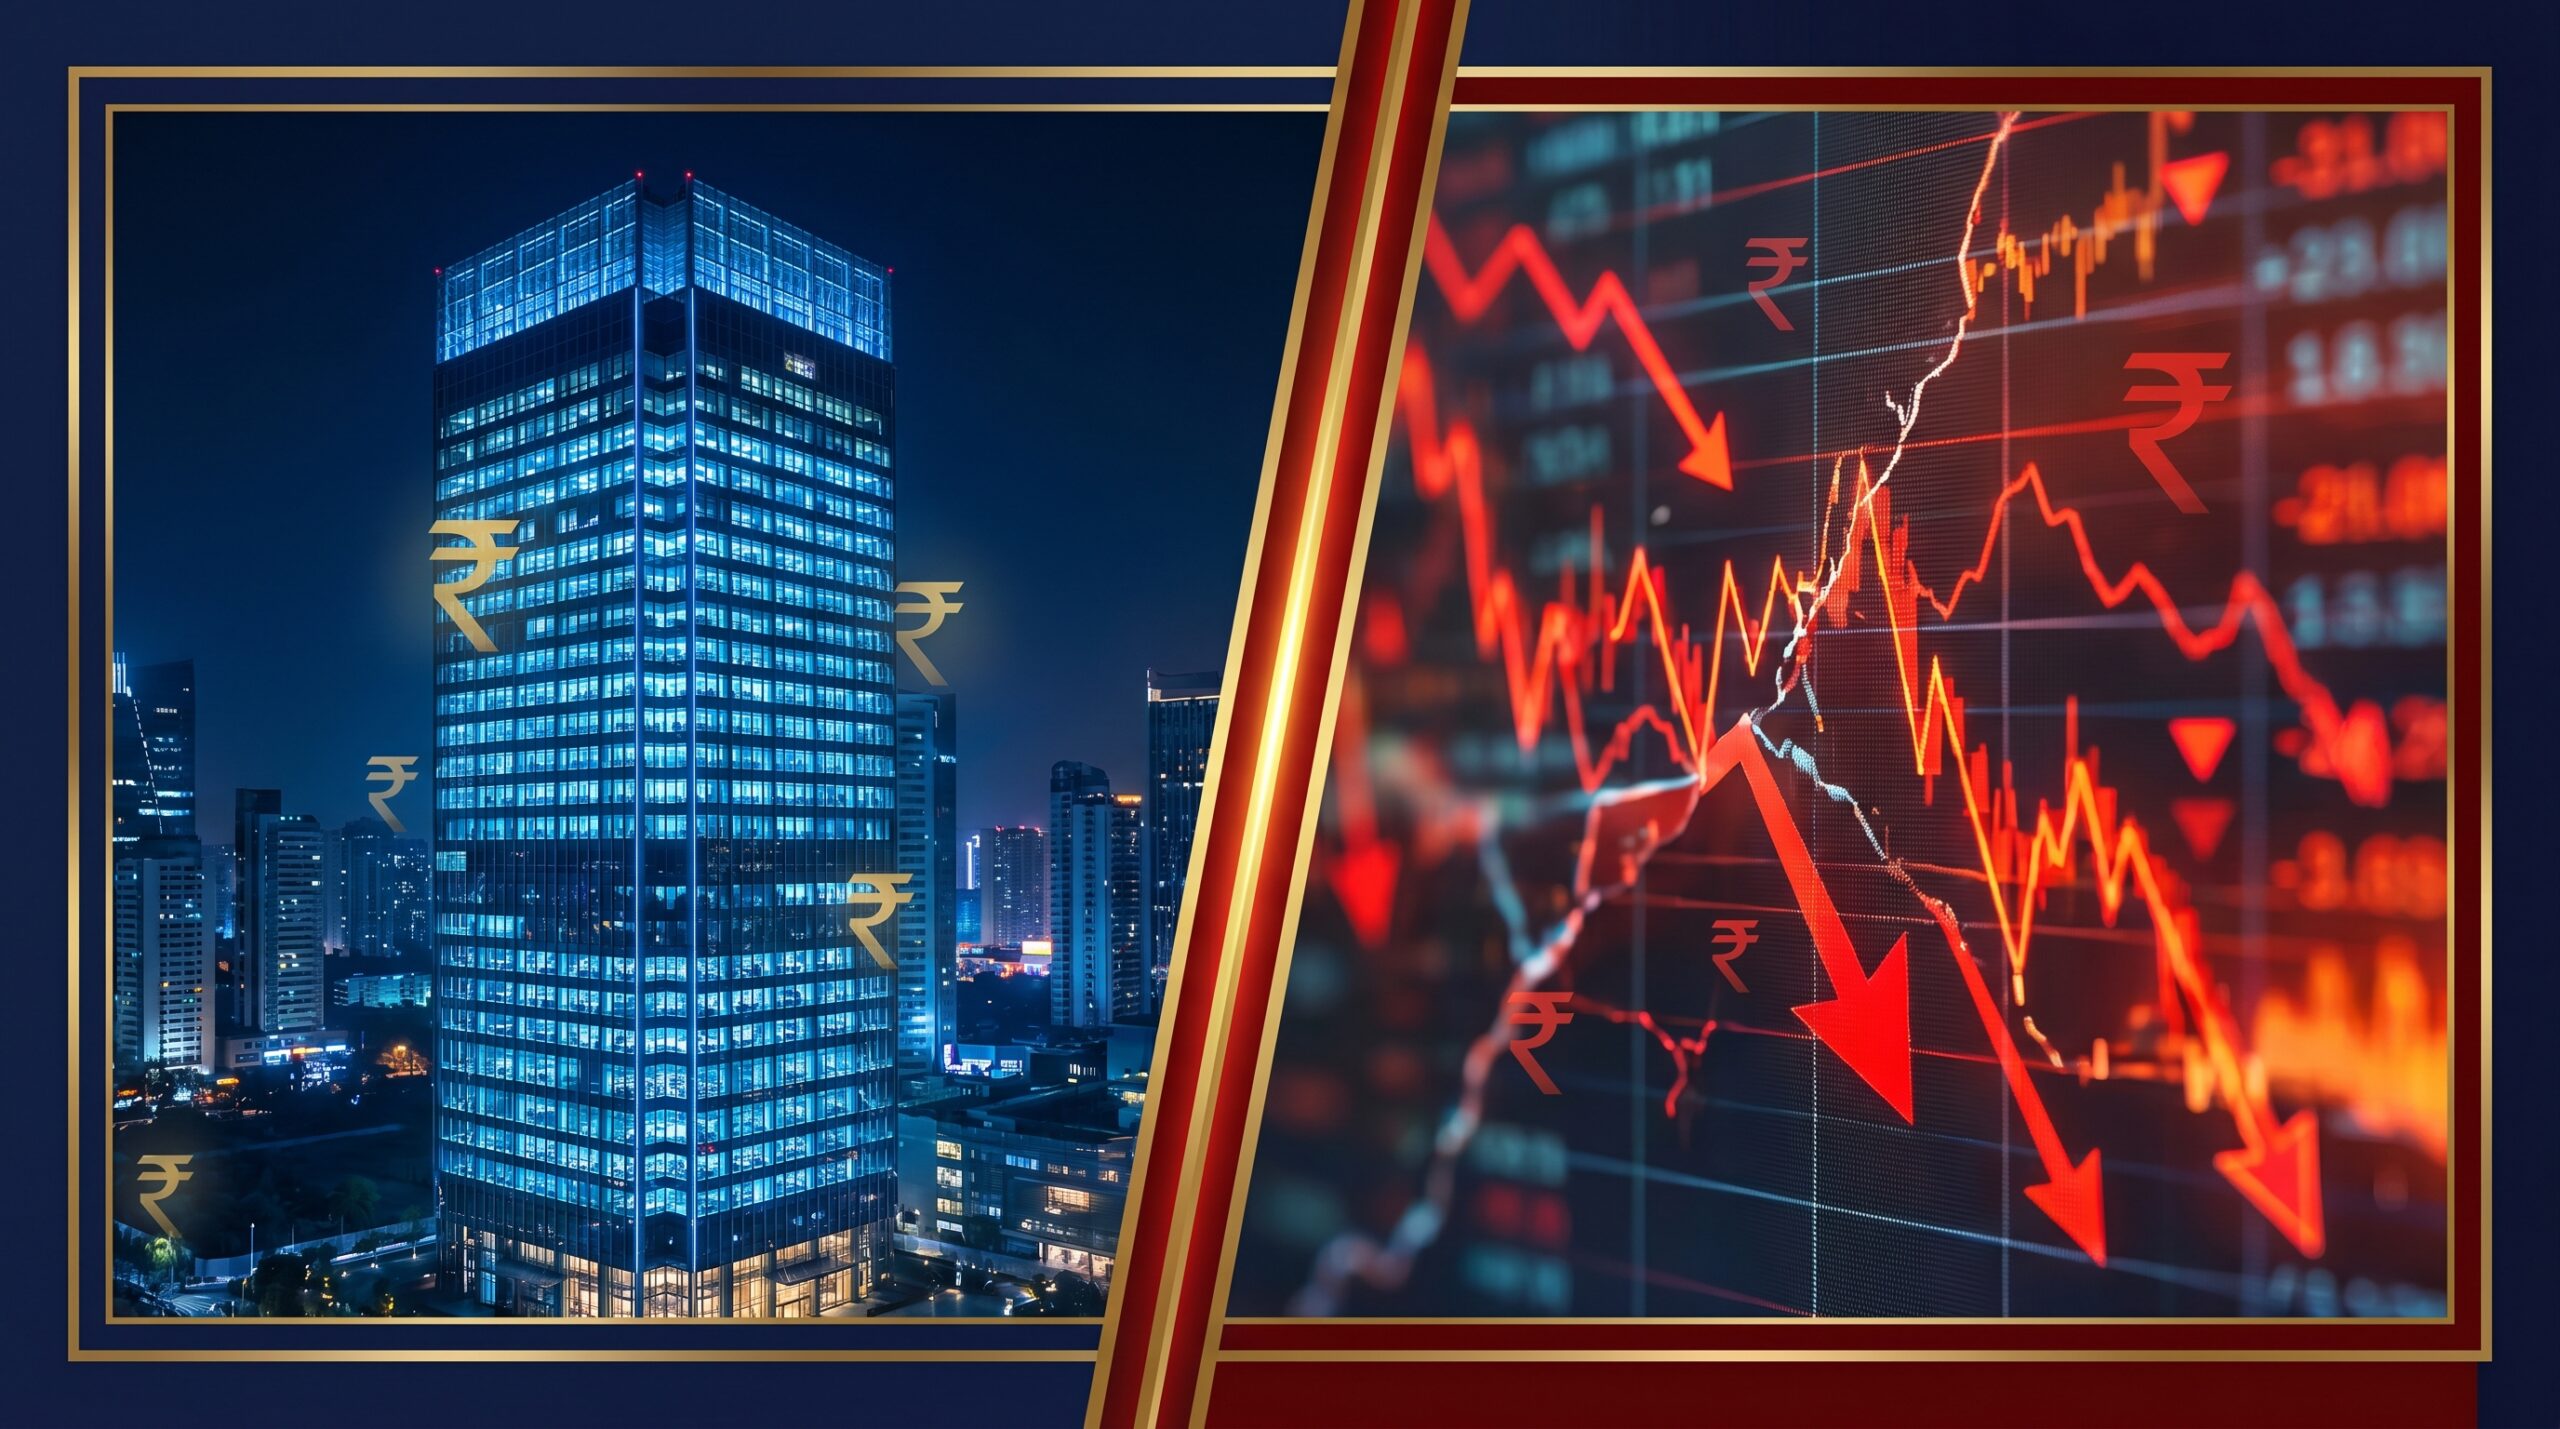
When global markets cough, small-cap stocks catch a fever. Right now, in 2026, the global economy isn’t just coughing — it has pneumonia. Crude oil has spiked to $115 per barrel. The Rupee has bled past ₹96 to the Dollar, a historic low. Foreign investors have pulled more than $20 billion out of Indian equities. This is not a mild correction. This is a stress test — for the economy, for companies, and for every retail investor who chased returns without fully understanding the risks.
The smart money is moving fast. Institutional investors are fleeing the speculative “froth” of small-caps and seeking the fortress-like balance sheets of large-cap giants. This is the classic flight to quality. And whether you participate consciously or not, your portfolio will feel it.
“Indian markets have remained quite resilient, although volatility has increased. But it is not beyond something markets cannot handle. The advantage of resilient markets is that they are able to absorb different types of shocks.”
— SEBI Chairperson Tuhin Kanta Pandey, The Hindu, May 18, 2026
The Vicious Cycle: How a Conflict 3,000 km Away Drains Your Wallet
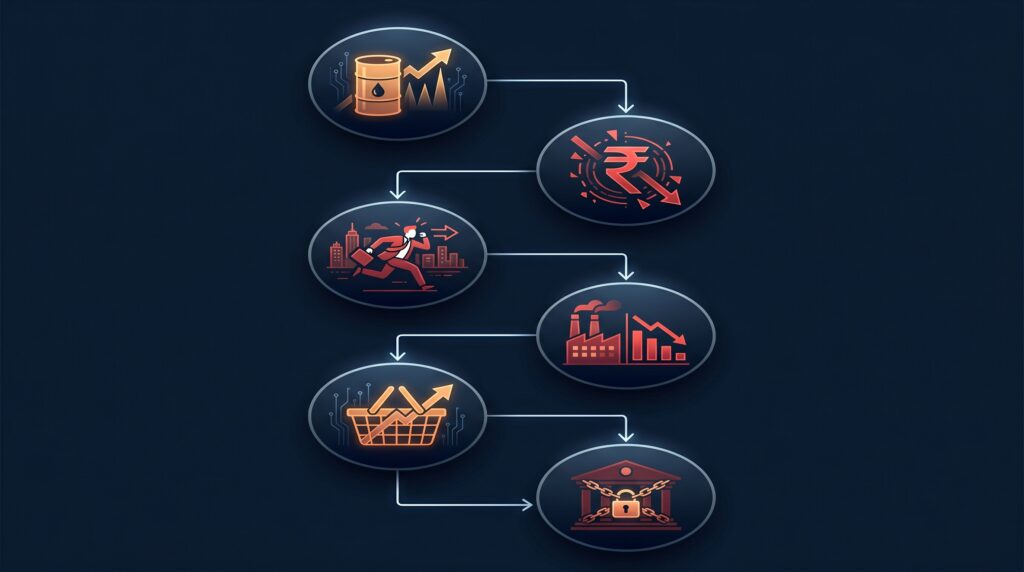
This isn’t abstract theory. There is a direct, traceable chain of cause and effect that connects a geopolitical conflict in the Middle East to the savings of a salaried professional in Pune.
Step 1 — Global Shock Conflict in the Middle East chokes supply chains, pushing global crude oil prices past $115 per barrel — a severe inflationary shock to the global economy.
Step 2 — Currency Bleed India imports approximately 85% of its oil. A higher import bill drains dollar reserves, crashing the Rupee past 96 to the USD — its worst level in history.
Step 3 — FII Panic Foreign Institutional Investors (FIIs) pull over $20 billion out of Indian equities to cut risk, aggressively dumping vulnerable stocks — especially small-caps.
Step 4 — Margin Squeeze Small-cap companies, lacking pricing power and heavily reliant on imported raw materials, see their profit margins crushed by inflation. Earnings collapse.
Step 5 — The Liquidity Trap Retail investors attempt to exit small-cap mutual funds, but low trading volumes mean fund managers can take 26 to 70 days to sell just 50% of their holdings — without crashing prices further. This is not a hypothetical scenario; SEBI’s mandated stress test disclosures have made these timelines public.
Step 6 — Flight to Quality Institutional capital rotates into large-caps — companies like Reliance, TCS, and HDFC Bank (cited here as structural examples of large market capitalisation, not as recommendations to buy or sell) — that have strong balance sheets, dollar-earning export revenues, and the scale to absorb the macroeconomic shock.
“It is like entering a Chakravyuh. In a crisis, you enter a Chakravyuh. Now, if you do not know the exit route, then the economy gets stuck, and you end up creating bigger problems than the ones you initially set out to tackle.”
— Former RBI Governor Shaktikanta Das, The Economic Times, April 2026
The Sharma Family: A Hypothetical Case Study in Risk Management
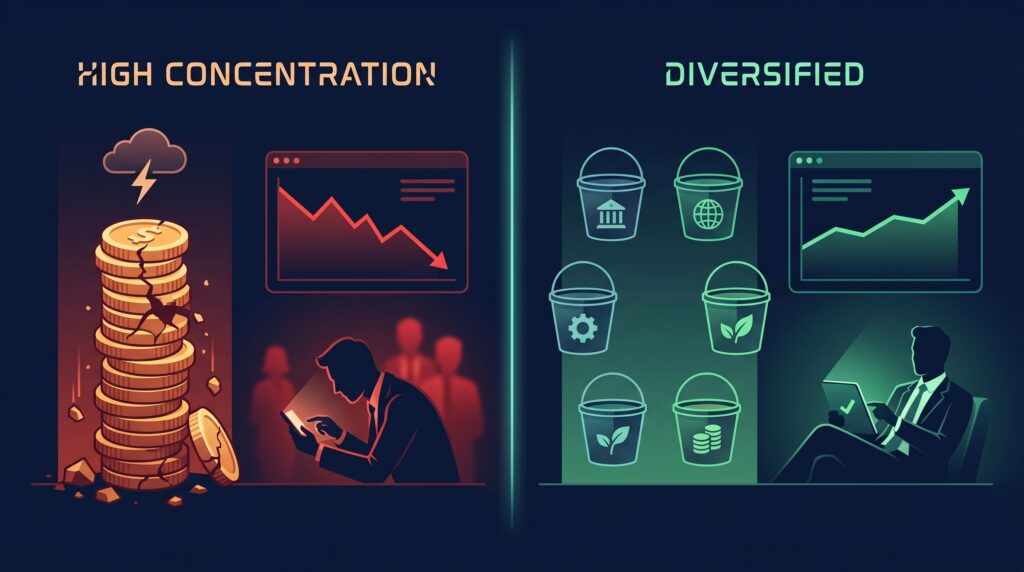
The following is a hypothetical illustration designed to explain how portfolio construction affects drawdown risk. It does not represent actual individuals or guarantee future performance.
Profile: Arjun Sharma, salaried IT professional, Pune. Annual income: ₹18 lakhs. Investable bonus: ₹5 lakhs.
Scenario A — High Concentration in Small-Caps
In 2024, Arjun sees his neighbour double his money in a niche manufacturing small-cap fund. He puts his entire ₹5 lakh bonus into a high-risk small-cap fund.
When oil hits $115 in 2026 and the market corrects, his portfolio drops a hypothetical 45% to approximately ₹2.75 lakhs. Because small-cap liquidity has dried up, his fund manager struggles to exit bad positions. Panic sets in. Arjun withdraws at the bottom, converting a temporary paper loss into a permanent realised loss.
Portfolio after correction: ~₹2.75 lakhs
Scenario B — A Diversified, Risk-Managed Approach
Arjun ignores the neighbourhood hype and builds a foundation instead: 65% of his ₹5 lakhs into a Nifty 50 Index Fund, and 35% into a Flexi-Cap fund.
During the 2026 oil shock, the large-cap portion of his portfolio absorbs much of the blow, hypothetically dipping around 15%. His total portfolio falls to approximately ₹4.3 lakhs. Because he is not wiped out, he does not panic. He continues his monthly SIPs, buying more units at lower prices — which, based on historical patterns of market recovery, has tended to improve long-term outcomes. Past market cycles do not guarantee that future recoveries will follow the same trajectory.
Portfolio after correction: ~₹4.3 lakhs
The difference between these two scenarios isn’t just ₹1.55 lakhs. It is the difference between panic-selling at the bottom and maintaining the composure to stay invested. That psychological and financial gap has the potential to compound significantly over time.
Large-Cap vs Small-Cap: Side by SideYour Attractive Heading
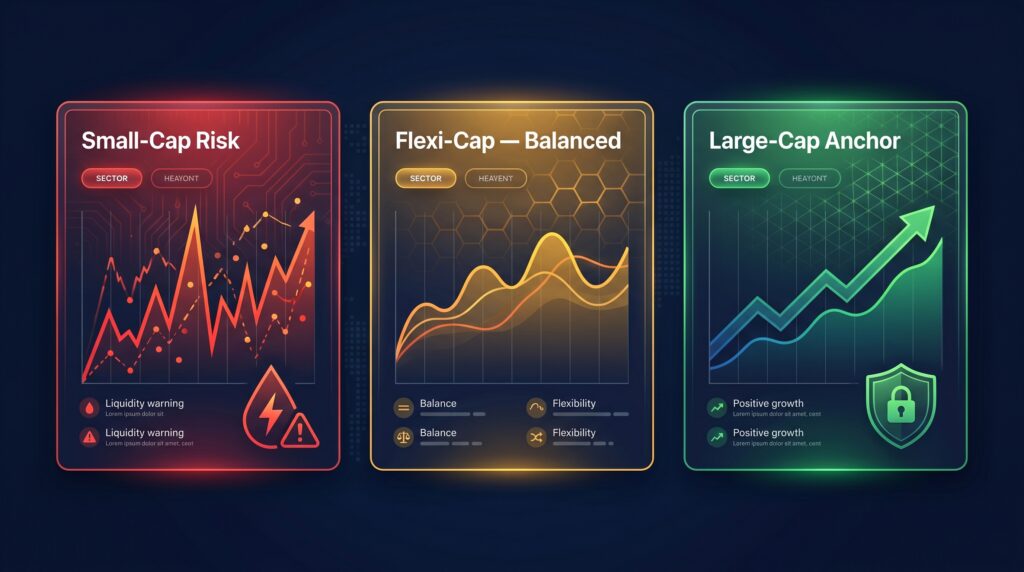
|
Feature |
Large-Cap Stocks |
Small-Cap Stocks |
|---|---|---|
|
Market Position |
Top 100 companies; proven market leaders |
251st onwards; emerging businesses |
|
Crisis Behaviour |
Tends to anchor portfolios during macro shocks |
Highly sensitive to inflation and rate hikes |
|
Historical Returns |
Steady compounding (12–14% historical CAGR) |
High variance — multibagger potential or severe loss |
|
Typical Drawdown in Crashes |
Historically 25–35% |
Historically 40–60% |
|
Liquidity |
Very high; exit anytime |
Very low; SEBI stress tests show 26–70 days for 50% liquidation |
|
Tax Treatment |
12.5% LTCG (standard) |
12.5% LTCG (standard) |
Historical drawdown data sourced from Motilal Oswal, March 2026. Past performance does not guarantee future results.
Common Portfolio Strategies During Market Volatility
The following outlines how investors with different financial profiles have historically approached risk management during periods of macroeconomic stress. These are educational illustrations of general strategies — not personalised financial directives. Your own situation, risk tolerance, and goals may differ significantly. A SEBI-registered investment adviser is best placed to guide your specific decisions.
Salaried Individuals A common approach among risk-aware salaried investors is to continue systematic investments (SIPs) through volatility rather than stopping them, as market corrections can allow the purchase of more units at lower prices. Many choose to direct new capital toward broader, more liquid funds — such as large-cap index funds or flexi-cap funds — to build a more stable core before adding higher-risk allocations.
Business Owners and MSMEs Business owners often recognise that their own enterprise already functions as a concentrated, illiquid, high-risk asset — conceptually similar to a single-stock bet. A common strategy for this profile is to keep emergency and operating liquidity separate from equity markets altogether, often in short-duration debt instruments or fixed deposits.
Investors Reviewing Existing Portfolios During periods of elevated volatility, many investors choose to review their overall allocation and assess whether their small-cap exposure is proportionate to their actual risk tolerance and investment horizon. The SEBI-mandated stress test disclosures are a useful starting point for understanding how liquid your fund’s holdings actually are.
Families with Near-Term Financial Goals Investors with goals inside a 5-year window — such as a child’s education or a home purchase — typically prioritise capital preservation over growth during volatile periods. Consistent, compounding returns in liquid, diversified funds have historically been more reliable for goal-based investing than high-variance, low-liquidity allocations.
“It is not appropriate to allow the froth to keep building.”
— Former SEBI Chairperson Madhabi Puri Buch, on small and mid-cap valuations
What SEBI and the RBI Are Doing?
SEBI SEBI has consistently flagged valuation concerns in the small and mid-cap space. In a significant step toward retail investor protection, it mandated public disclosure of mutual fund stress test results — requiring fund houses to reveal exactly how many days it would take to liquidate their small-cap positions under market stress. Some funds disclosed timelines of up to 70 days to liquidate just 50% of their portfolio. This is a factual, publicly available figure — not an interpretation.
The RBI The Reserve Bank of India is actively managing currency stability, with the Rupee under pressure at the 96 mark. The central bank’s strategy relies on deploying foreign exchange reserves to cushion the broader economy against imported inflation driven by high oil prices. The RBI is simultaneously managing inflation, growth, and currency depreciation — a genuinely difficult balance.
The Contrarian View: Don’t Write Off Small-Caps Entirely
A thoughtful counterargument exists and deserves attention.
Critics argue that the “flight to quality” is a knee-jerk reaction by risk-averse institutional managers responding to short-term noise. India’s domestic growth story — from specialised defence manufacturing to tier-2 city consumption to contract manufacturing — is driven almost entirely by mid and small-cap companies. Large-cap index funds, meanwhile, are heavily concentrated in financial services and IT companies with meaningful exposure to Western banking cycles and global tech spending.
By retreating entirely to large-caps, retail investors may be purchasing slow-growing giants at elevated valuations and missing the structural compounders of India’s next decade.
The more nuanced position: the problem has never been small-caps themselves. It is excessive, uninformed, and herd-driven concentration in small-caps — without understanding liquidity risk or having the time horizon to absorb deep drawdowns — that causes the most lasting damage to retail portfolios.
Data Verification
|
Data Point |
Value |
Source |
Status |
|---|---|---|---|
|
Crude Oil Price Spike |
$115/barrel |
Vajiram & Ravi (May 2026) |
✅ Confirmed |
|
Rupee vs USD |
Crossed ₹96 |
FMT (May 2026) |
✅ Confirmed |
|
Foreign Investor Outflows |
> $20 Billion |
Reuters / FMT (May 2026) |
✅ Confirmed |
|
Flexi-Cap Inflows |
₹10,147 Crore |
✅ Confirmed |
|
|
Small-Cap Stress Liquidation |
26 to 70 days |
Kunvarji Wealth (Jan 2026) |
✅ Confirmed |
|
Current Account Deficit |
>2% of GDP |
Bank of America / FMT (May 2026) |
⚠️ Estimated |
Also read:
- The Gyani Turtle Inflation Impact Calculator: See How Much Your Cash Loses Value Over Time
- Is Nifty IT Safe to Invest in 2026? The AI Disruption Truth
- The White Collar Recession Nobody Is Talking About
Regulatory Disclosure & Legal Disclaimer: This article is published exclusively for educational, informational, and investor awareness purposes. The owner of Gyaniturtle.com is not a SEBI-registered Investment Advisor (IA) or a SEBI-registered Research Analyst (RA). This content does not constitute financial advice, investment recommendations, or an offer or solicitation to buy or sell any specific securities, mutual funds, or financial products.
All data, metrics, and case studies (including the hypothetical Sharma family example) are presented for educational context and illustrative purposes using historical market data, which has been compiled with a mandatory lag to maintain objective educational compliance. Capital market investments carry inherent market risks. Past historical performance is never a reliable guarantee of future market returns. Readers are strictly advised to perform independent research and consult a certified, SEBI-registered financial professional before executing any personal investment or asset allocation decisions.

At Gyani Turtle, we believe every Indian deserves access to honest, jargon-free financial education. Our team simplifies investing, mutual funds, and personal finance — so you can build real wealth, one smart decision at a time. Not SEBI registered. For educational purposes only.