
Market Volatility Reasons India: 3 Reasons Not to Panic
The 30-Second Sip: When tracking historical market corrections, sharp drawdowns can test any investor’s patience. For instance, following the January peak of 26,373, the Nifty 50 recorded a notable shift of 14.09%. During such macroeconomic cycles, global Brent crude has hit highs of $126/barrel, wholesale (WPI) inflation has touched 8.3%, and domestic fuel costs adjusted upward by ₹4/litre. Before reacting emotionally to short-term changes—it helps to look at history. Understanding the broader market volatility reasons India experiences during global energy shocks is the secret to avoiding the most expensive mistake in investing: panic selling.
A sea of red numbers on an investment app can be unsettling. When headlines focus heavily on oil supply corridors, inflation metrics, and sharp market pullbacks, it is natural for retail investors to second-guess their strategy.
A common question naturally surfaces: “Should I just liquidate my equity portfolio?”
Before acting on short-term fear, it is valuable to look at market history.
The macroeconomic factors steering market cycles are quantifiable, explainable, and historically cyclical. Conversely, the capital erosion caused by locking in paper losses at the absolute trough of a market correction can have a permanent impact on long-term wealth goals.
At Gyani Turtle, we focus on objective data over emotional reactions. Below is an educational analysis of how global and domestic economic vectors interact to create equity market cycles, and how long-term behavioral discipline helps navigate them.
The Verified Numbers Behind Today’s Volatility
Before analyzing investor behavior, let us look at the historical data. The metrics below outline how specific commodity spikes and inflationary pressures have structurally influenced Indian equity benchmarks over time:
|
Historical Macro Dataset |
Metric Value |
Verified Information Source |
Data Status |
|---|---|---|---|
|
Nifty 50 Market Benchmark Peak |
26,373 |
NSE India Historical Archives |
✅ Historical Record |
|
Subsequent Benchmark Correction Trough |
23,114 (–14.09%) |
NSE India Historical Archives |
✅ Historical Record |
|
Peak Brent Crude Oil Unit Price |
$126/barrel |
Global Energy Index Records |
✅ Historical Record |
|
Commodity Stabilization Phase Price |
$105.29/barrel |
Global Commodity Index Data |
✅ Historical Record |
|
Wholesale Price Index (WPI) Peak |
8.3% YoY — 42-month high |
Ministry of Commerce & Industry |
✅ Historical Record |
|
Domestic Fuel Price Adjustment |
₹4/litre Increase |
Oil Marketing Companies (OMCs) |
✅ Historical Record |
|
Historical 2008 Drawdown (Peak to Trough) |
–61.5% |
NSE India Market History |
✅ Historical Record |
|
Historical 2008 Complete Recovery |
71 months |
Indian Capital Markets Research |
✅ Historical Record |
|
Historical 2020 Single-Day Intraday Drop |
–13.15% (March 23, 2020) |
BSE Sensex Historical Records |
✅ Historical Record |
|
Historical 2020 Subsequent Recovery Cycle |
+140% by late 2021 |
BSE Sensex Historical Records |
✅ Historical Record |
Note: This asset class comparison assumes the baseline macro conditions and specific market volatility reasons India remains volatile through mid-2026.
Two specific lines at the bottom of this macro data table merit close attention.
During the global health crisis in March 2020, the Sensex experienced a dramatic single-day drop of 13.15%. Retail market participants who reacted out of panic and liquidated equity assets permanently locked in severe capital losses. Conversely, those who maintained their systematic allocations or increased equity exposure observed the same index gain 140% over the subsequent 18 months.
This pattern highlights an enduring financial reality: market cycles tend to reward long-term behavioral discipline while penalizing short-term emotional reactions.
Explaining the Top Market Volatility Reasons India is Facing
Understanding the structural drivers behind equity drawdowns is essential for making rational, long-term asset allocation choices.
Reason 1 — How the Energy Shock Drives Market Volatility Reasons India
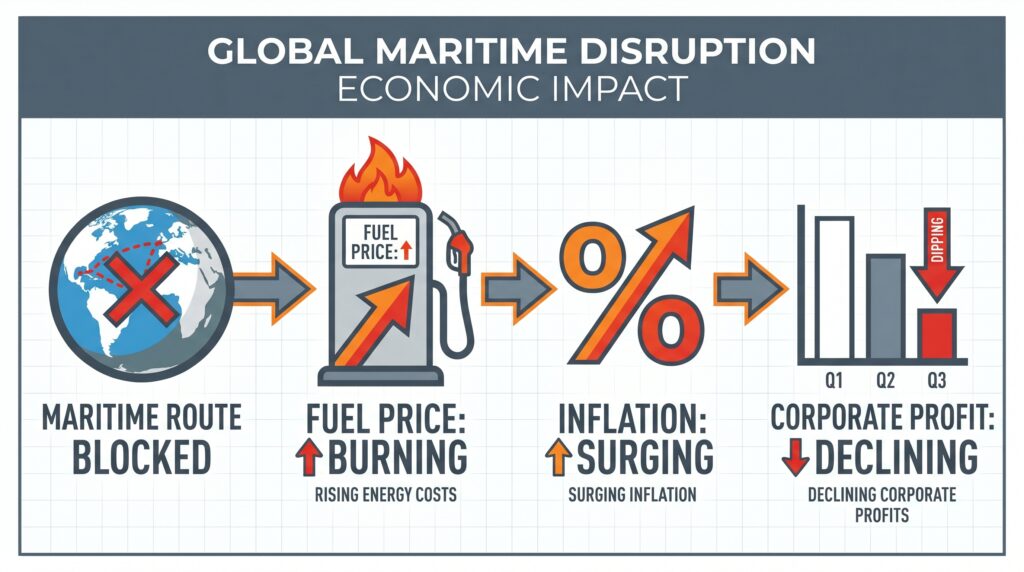
The Strait of Hormuz—a crucial 33-kilometer maritime transit corridor between Oman and Iran—facilitates nearly 20% of the world’s daily petroleum supply. Geopolitical disruptions in this zone can cause a massive contraction in vessel traffic, leading to an immediate global supply deficit. This friction represents one of the major market volatility reasons India encounters during global energy shocks.
Because India imports approximately 85% of its crude oil requirements, a sudden escalation in global Brent crude prices exerts direct pressure on the nation’s balance of payments. For every prolonged surge in oil prices, India’s national import bill expands, which structurally widens the Current Account Deficit (CAD).
The Portfolio Link: Elevated crude oil prices naturally increase input costs, compressing operating profit margins across energy-sensitive domestic sectors such as logistics, FMCG, paints, automotive, and chemicals. When the Current Account Deficit widens, Foreign Institutional Investors (FIIs) often reduce exposure to emerging market equities, contributing to localized benchmark corrections.
Reason 2 — Wholesale Inflation Spike & Market Volatility Reasons India
When the Wholesale Price Index (WPI) touches a multi-month high of 8.3%, it reflects rising industrial input costs that typically pass through to consumer retail prices (CPI) with a standard 4-to-8 week lag. Accompanied by necessary domestic fuel price adjustments by local oil marketing companies, retail inflation can stabilize around a sticky 6.9% baseline.
The Portfolio Link: Persistent inflation alters the trajectory of central bank monetary policy. When wholesale inflation remains high, the Reserve Bank of India (RBI) faces constraints that prevent it from lowering the repo rate. Prolonged periods of elevated interest rates keep corporate borrowing costs high, which can temper capital expenditure (CapEx) and slow short-term corporate earnings growth, mechanically compressing stock market valuations.
Reason 3 — Global Capital Outflows and Market Volatility Reasons India
During intervals of heightened macroeconomic or geopolitical friction, global institutional capital frequently undergoes a “risk-off” rotation. Foreign Institutional Investors (FIIs) typically systematically reallocate capital out of emerging market equities and into lower-risk global safe havens, such as US Treasury bonds, the US Dollar index, or gold.
This institutional selling does not imply a structural flaw in India’s long-term economic fundamentals. Rather, it is a mechanical capital-flow pattern observed across every major global market cycle. Massive institutional selling temporarily disrupts the immediate demand-supply balance in domestic large-cap equities, causing asset prices to drop regardless of an individual company’s underlying financial health.
The Sharma Family: Analyzing Two Asset Behavioral Approaches
To understand how sudden market movements impact long-term financial paths, let us evaluate an educational case study mapping two distinct psychological responses to macroeconomic shifts.
The Context: Consider a hypothetical household—Rohit and Meera Sharma from Noida. They maintain a mutual fund equity portfolio with a cost basis of ₹12,00,000, built over 5 years via a disciplined ₹25,000 monthly Systematic Investment Plan (SIP). Following a sharp 14% market correction, the nominal portfolio value temporarily declines to ₹10,31,000, reflecting an intermediate paper drop of ₹1,69,000.
Rohit and Meera Sharma, Noida. Combined income: ₹1.5 lakh/month. Mutual fund portfolio: ₹12,00,000 built over 5 years via ₹25,000 monthly SIP. Outstanding home loan EMI: ₹38,500.
The Nifty corrects 14%. Their portfolio drops from ₹12,00,000 to ₹10,31,000 — a paper loss of ₹1,69,000.
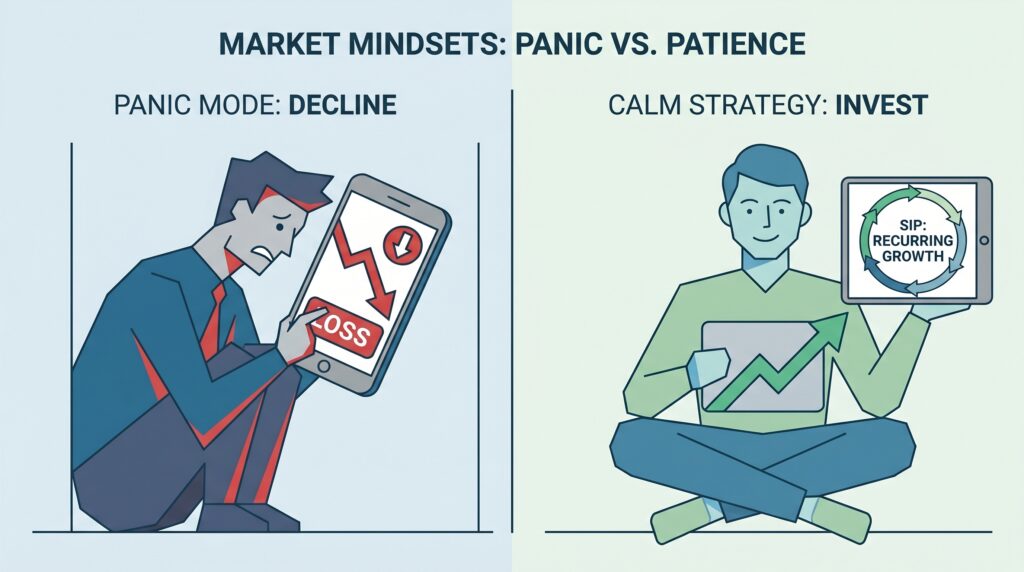
❌ Behavioral Approach A — Liquidating the Portfolio
Overwhelmed by macroeconomic headlines and short-term capital fluctuations, Rohit decides to mitigate further downside risk.
The action: He stops all active monthly SIPs and liquidates the entire equity balance of ₹10,31,000, transferring the proceeds into a standard savings account yielding an average 3.5% per annum.
The Financial Impact: The temporary paper fluctuation of ₹1,69,000 is transformed into a permanent, irrecoverable capital loss.
The Long-Term Result: Over the subsequent 18 months, geopolitical pressures ease, crude oil prices normalize, and the equity benchmark stages a 30% recovery. Rohit’s capital remains locked in cash earning 3.5%, while a retail inflation rate of 6.9% creates a negative real return of –3.4% annually, significantly delaying his long-term retirement timeline.
✅ Behavioral Approach B — Maintaining Systematic Discipline
Meera evaluates the exact same temporary decline but reviews historical market data instead of short-term headlines. She reviews past cycles, noting the 2008 correction and the rapid 2020 recovery curve.
Action Taken: She maintains the monthly ₹25,000 SIP without interruption, allowing the strategy to systematically purchase mutual fund units at lowered Net Asset Values (NAVs). Additionally, she deploys a planned ₹50,000 cash buffer from their surplus liquid reserves into a diversified large-cap index fund while valuations are low.
The Financial Impact: No paper losses are realized. The portfolio continues to accumulate lower-cost units throughout the downward leg of the market cycle.
The Long-Term Result: When the underlying equity benchmark recovers over the next 18 months, the core portfolio rebounds past its prior peak. The lower-cost units acquired systematically during the market downturn compound efficiently, generating substantial incremental wealth for the household.
Asset Class Characterization and Educational Context

When evaluating long-term asset allocation, different financial instruments serve distinct structural roles within a household budget:
|
Investment Class |
General Macroeconomic Interaction |
Historical Inflation Correlation (vs 6.9% Baseline) |
Core Risk Profile |
Tax Angle |
Portfolio Function |
|---|---|---|---|---|---|
|
Cash & Standard Savings Instruments |
Provides absolute capital liquidity; does not fuel productive corporate economic growth. |
Typically trails high inflation, resulting in minor negative real yields over long periods. |
Interest income is aggregated and taxed at the individual’s income slab rate. |
Interest taxed at full income slab |
Designed strictly for short-term liquidity and immediate emergency reserves. |
|
Diversified Equity Mutual Funds |
Channels retail capital directly into top-tier corporate assets and infrastructure. |
Historically beats inflation over multi-year horizons (12-15% long-term historical CAGR). |
Subject to Long-Term Capital Gains (LTCG) tax rules based on holding duration. |
LTCG taxed at flat rate — highly efficient |
Intended for long-term capital compounding and wealth creation goals. |
|
Bank Fixed Deposits (Medium-Term) |
Absorbs retail liquidity to stabilize banking sector lending books. |
Generally matches or slightly trails baseline retail inflation metrics. |
Interest earnings are fully taxable according to the individual’s income tax slab. |
Interest taxed at income slab |
Ideal for protecting intermediate capital or short-term milestone goals. |
|
Sovereign Gold Bonds (SGBs) / Bullion |
Acts as a traditional global safe haven and systemic currency hedge. |
Serves as an effective historical hedge against extreme global macro uncertainty. |
SGBs offer tax exemptions on capital gains if held until maturity. |
SGB: tax-free at maturity; Physical: LTCG applies |
Serves as an asset class diversifier and portfolio volatility dampener. |
The table makes one thing undeniable: the only option that guarantees you lose money in real terms is the one that feels safest in the moment — moving to cash.
Navigating Changing Valuation Cycles Effectively
For Long-Term Systematic Investors:
IMaintaining active equity SIPs during an index correction allows rupee-cost averaging to function optimally. When market benchmarks decline, fixed monthly allocations naturally buy more units at lower prices. Pausing allocations during a correction removes the structural benefit of acquiring discounted units, which are vital for accelerating portfolio recovery when the cycle turns.
If household budgets face strain due to macro inflation or changes in floating-rate loan EMIs, financial planners typically suggest auditing discretionary, non-essential lifestyle expenses before halting long-term wealth investments.
For Allocating Investable Cash Reserves:
When deploying idle cash surpluses during volatile periods, utilizing a Systematic Transfer Plan (STP) over a 3-to-6 month horizon helps average into equity valuations safely. Attempting to pinpoint the absolute bottom of a market correction is mathematically impractical.
Focusing allocations toward stable companies featuring resilient balance sheets, low debt-to-equity ratios, and robust pricing power provides a structural cushion against macro shocks. Conversely, high-beta, speculative micro-cap assets lacking sustainable cash flows often experience severe margin compression during commodity supply shocks.
For Household Budget Management:
A practical defense against a sticky 6.9% consumer inflation baseline involves adjusting monthly household expense tracking. Prioritizing wholesale buying for staples, managing discretionary transportation costs, and maintaining a dedicated, liquid emergency fund equivalent to 6 months of absolute living expenses helps insulate the household. Emergency capital should remain preserved in low-risk instruments, like liquid mutual funds or high-yield savings accounts, rather than being risked in equity markets during high-volatility windows.
Objective Risk Factors to Consider
While maintaining long-term equity allocations is statistically sound, sound financial planning requires analyzing the counter-arguments and risks inherent to down-market cycles:
Immediate Liquidity Pressures: Advising households to lock away capital for extended multi-year horizons can be impractical if immediate liquid cash flows are strained. If a family lacks an emergency fund and faces near-term commitments, strategically reallocating a portion of equity assets to build liquid cash reserves is a necessary step to stabilize household finances.
Variable Recovery Timelines: Historical market cycles demonstrate that asset recoveries vary greatly. The 2020 market rebound occurred swiftly due to synchronized global central bank rate cuts and massive monetary easing. In contrast, the 2008 structural recovery required 71 months to reclaim previous highs. In high-inflation regimes where central banks cannot aggressively cut rates, recovery timelines may be prolonged.
Concentration Vulnerabilities: The principle of staying invested assumes a well-diversified equity base. If an individual’s holdings are heavily concentrated in speculative, high-debt small-cap stocks lacking institutional backing or transparent earnings, a market downturn can cause permanent capital impairment rather than temporary paper fluctuations.
The Gyani Turtle Verdict
The macroeconomic headwinds affecting global and domestic asset markets—ranging from energy supply constraints to elevated interest rate environments—are documented, measurable realities. However, historical capital market data underscores that index benchmarks have reliably navigated prior economic crises, ranging from the structural shocks of 2008 to severe single-day drawdowns in 2020, eventually setting new highs over long horizons.
The defining variable separating different financial outcomes during market corrections is not access to specialized information, but behavioral patience.
Equities function over long cycles by systematically transferring reward from impatient market participants to disciplined, long-term investors.
Approach investments with patience, analyze data deeply, and manage risk systematically..
The stock market is not a device for transferring wealth from the market to investors. It is a device for transferring wealth from the impatient to the patient.
Right now, the question is simple: which one are you?
Invest patiently. Analyze deeply. React rarely.
That’s the Gyani Turtle way. 🐢
Also read:
- The Gyani Turtle Inflation Impact Calculator: See How Much Your Cash Loses Value Over Time
- Is Nifty IT Safe to Invest in 2026? The AI Disruption Truth
- The White Collar Recession Nobody Is Talking About
Regulatory Disclosure & Legal Disclaimer: This article is published exclusively for educational, informational, and investor awareness purposes. The owner of Gyaniturtle.com is not a SEBI-registered Investment Advisor (IA) or a SEBI-registered Research Analyst (RA). This content does not constitute financial advice, investment recommendations, or an offer or solicitation to buy or sell any specific securities, mutual funds, or financial products.
All data, metrics, and case studies (including the hypothetical Sharma family example) are presented for educational context and illustrative purposes using historical market data, which has been compiled with a mandatory lag to maintain objective educational compliance. Capital market investments carry inherent market risks. Past historical performance is never a reliable guarantee of future market returns. Readers are strictly advised to perform independent research and consult a certified, SEBI-registered financial professional before executing any personal investment or asset allocation decisions.
At Gyani Turtle, we believe every Indian deserves access to honest, jargon-free financial education. Our team simplifies investing, mutual funds, and personal finance — so you can build real wealth, one smart decision at a time. Not SEBI registered. For educational purposes only.