What are the best Charting platforms?
If you have spent any time trying to map out support levels or track candlestick patterns, you have probably run into a frustrating wall: your default broker charts.
Most retail traders start their journey using the free, built-in charting tools provided by their stockbrokers. At first, they seem fine. But the moment you try to open multiple layouts, apply custom indicators, or expect your drawn trendlines to actually save when you refresh the page, the system slows down or crashes entirely.
When you are actively tracking volatile markets, a lagging, clunky interface is more than just annoying—it actively gets in the way of clear objective analysis.
Your charting software is your primary analytical workspace. It needs to be fast, stable, and highly intuitive. To help you cut through the marketing noise, this guide breaks down the best charting platforms for technical analysis available today, focusing on data reliability, ease of use, and practical features.
What Actually Matters in a Charting Platform?
Before looking at specific software, it helps to understand what separates a premium charting platform from a low-tier broker tool. When evaluating your options, prioritize these three core benchmarks:
- Data Latency: Does the tick-by-tick data refresh instantly in real time, or are you looking at a delayed “snapshot” feed that only updates every few seconds? For fast-moving markets, sub-second data transmission is essential.
- Multi-Device Cloud Syncing: If you draw a key support zone or trendline on your desktop application during weekend research, does it instantly appear on your mobile app when you open it during market hours?
- Indicator Depth and Customization: Beyond the cookie-cutter Relative Strength Index (RSI) or simple moving averages, does the platform allow you to adjust inputs, backtest strategies, or run custom community-built scripts?
Let’s look at how the market’s top contenders stack up against these benchmarks.
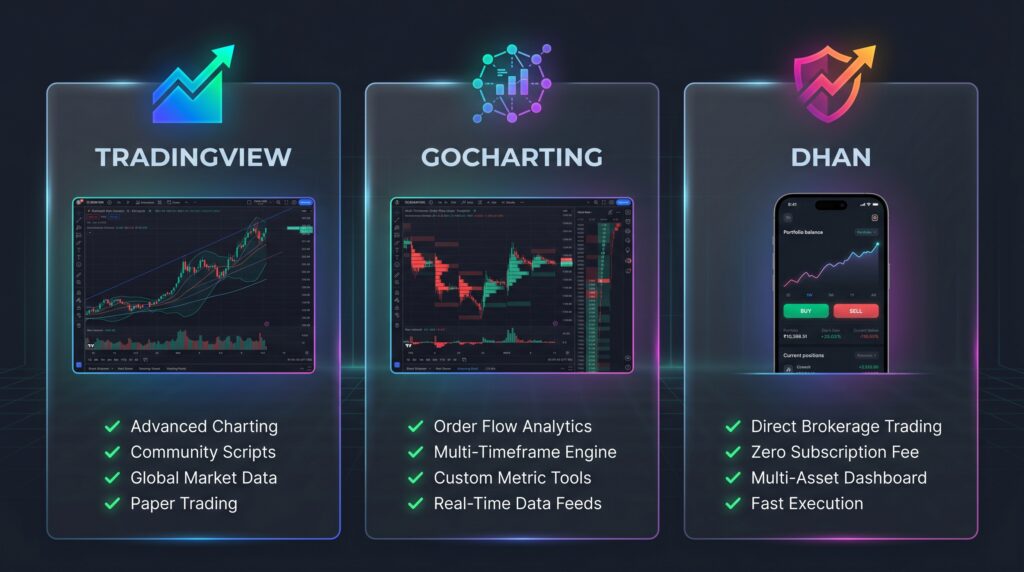
1. TradingView: The Industry Standard for Modern Charting
When looking for the best charting platforms for technical analysis, TradingView is almost always the first recommendation you will encounter—and for good reason. It has completely transformed how retail and institutional market participants visualize market data over the last decade.
Unlike older legacy software that required heavy desktop installations and constant manual data feed configurations, TradingView is entirely cloud-based. It runs flawlessly inside any modern web browser or via a lightweight desktop app, syncing your workspace instantaneously across your laptop, tablet, and smartphone.
Why It Dominates the Market
- Impeccable User Experience: The charting interface is incredibly smooth. Zooming in on micro timeframes or panning across years of historical price action happens with zero rendering lag.
- The Pine Script Ecosystem: This is TradingView’s biggest competitive advantage. Beyond standard tools like the Relative Strength Index (RSI) or Exponential Moving Averages (EMA), it hosts an open-source library of millions of community-created scripts. If an analytical model exists, someone has likely built it in Pine Script.
- Global Market Coverage: Whether you are analyzing Indian equities on the NSE, global currencies, commodities, or international indices, the platform aggregates real-time and delayed data feeds from almost every major global exchange.
The Trade-Offs to Keep in Mind
While the platform offers a highly capable free tier, it operates on a freemium model. If you want to view more than two indicators simultaneously, open multi-chart layouts (such as viewing a 15-minute chart right next to a daily chart), or set up multiple real-time price alerts, you will need to upgrade to a paid monthly subscription.
Furthermore, because it is an open-source community hub, beginners can easily fall into “indicator overload”—cluttering their screens with too many overlapping calculations instead of focusing on clean price action.
2. GoCharting: The Advanced / Order Flow Choice
If TradingView is the king of traditional visual charting, GoCharting is the specialist tool built for advanced data analysis. It targets a specific subset of the trading community: those who want to look inside individual candlesticks to analyze buying and selling pressure as it happens.
GoCharting has gained massive popularity because it brings institutional-grade order flow analytics into a standard web browser, bypassing the need for expensive, clunky software setups.
Why It Stands Out
- Native Order Flow Tools: It is one of the very few web platforms that supports complex Volume Profiles, Market Profiles, and Footprint (Cluster) charts right out of the box.
- Built-In Tick-by-Tick (TBT) Data: While other platforms charge hefty premium connection fees for raw data, GoCharting packs institutional-grade streaming data feeds directly into its paid Indian market tiers.
- Advanced Options Analytics: Beyond charting standard stock prices, it features comprehensive options strategy builders and custom options charting tools.
The Trade-Offs to Keep in Mind
Because it packs incredibly dense data structures onto the screen, GoCharting has a steeper learning curve than TradingView. The user interface can feel intimidating to a beginner who simply wants to draw basic support and resistance lines.
3. Dhan: Premium Charting Met With Direct Execution
For traders who love TradingView’s clean interface but hate paying monthly subscription fees or dealing with disconnected broker logins, Dhan (via tv.dhan.co) offers an elegant compromise.
Dhan has deeply integrated TradingView’s core framework directly into its native brokerage infrastructure. This means you get a massive portion of TradingView’s premium features completely free of charge, directly tied to an active execution portal.
Why It Stands Out
- Zero Subscription Fees: You get multi-display layouts, unlimited indicators, and premium drawing memory without paying a monthly premium subscription fee.
- Direct-from-Chart Execution: There is zero friction between analysis and execution. You can modify stop-loss levels or trigger market orders by clicking and dragging directly on your active chart layout.
- Uncompromised Speed: Because the charts run natively on the broker’s own exchange servers, data updates instantly via direct streaming feeds.
The Trade-Offs to Keep in Mind
Because tv.dhan.co is structurally a brokerage portal, you cannot write your own custom code blocks or run community-made Pine Scripts like you can on a standalone TradingView account. It is built for seamless execution and standard technical analysis, not custom algorithmic scripting.
Technical Comparison Matrix
To help you decide which workspace fits your practical workflow, here is how the platforms look head-to-head across core features:
|
Feature |
TradingView |
GoCharting |
Dhan (tv.dhan.co) |
|---|---|---|---|
|
Pricing Structure |
Freemium model. Free basic version; paid tiers run from ₹1,295 to ₹4,995+/month (excluding tax). |
Freemium model. Free basic version; Indian market premium plans cost ₹1,499/month. |
₹0 (Free). Available to all active demat account holders with no monthly subscription fee. |
|
Data Feed Engine |
Snapshot or streaming (tier dependent). Real-time NSE data requires an extra monthly exchange add-on fee for lower tiers. |
Tick-by-Tick (TBT) streaming data feed included directly in their premium subscription tiers. |
Direct, real-time streaming feed directly sourced from the exchanges via broker infrastructure. |
|
Indicator Depth |
Unmatched. 100+ native indicators alongside access to millions of community-developed Pine Script codes. |
Specialized. Built-in institutional order flow tools like Footprint charts, Market Profile, and Volume Profile. |
Integrated. 100+ built-in premium TradingView indicators, options chains, and custom indicators natively available. |
|
Custom Scripting |
Yes (Native Pine Editor ecosystem for writing custom logic). |
Yes (Supports custom indicator scripting and modifications). |
No native script editor on the broker portal, but links directly to TradingView.com for execution. |
|
Execution Style |
Analytical portal requiring third-party broker login connection to execute trades. |
Analytical portal requiring third-party broker login connection to execute trades. |
Fully native direct trading console—draw, adjust, and execute orders directly on the layout. |
|
Link |
Critical Distinctions to Note
1. The Core Infrastructure Target
- TradingView is built as a global, multi-asset community dashboard. It functions as a flexible analytical sandbox but places features like multi-chart layouts and second-based intervals behind premium paywalls.
- GoCharting targets a specialized sub-segment of the trading market: order flow traders. It is one of the very few web-based platforms that handles the massive data processing required for tick-based footprint analysis and volume profiles.
- Dhan bridges the gap by embedding TradingView’s premium chart design directly into a brokerage terminal. It is built strictly for rapid, low-latency execution directly from the visual workspace.
2. Understanding Data Feed Mechanics
Data speed is determined by data types. Most default free plans display “snapshot data” (updating price points every few seconds). True real-time day trading requires “streaming tick data.” While TradingView requires non-professional or professional data subscription add-ons to unlock un-delayed Indian market streaming feeds, platforms like Dhan pass this data directly to the user through their clearing membership infrastructure.
The Bottom Line: Which One Should You Choose?
Selecting the right workspace comes down to identifying your style of interaction with the market:
- Choose TradingView if you want clean aesthetics, access to thousands of custom indicators, global assets, and a social network of fellow chartists.
- Choose GoCharting if you are an advanced intraday trader who needs Footprint charts, Market Profiles, and raw Tick-by-Tick volume analytics.
- Choose Dhan if you want the visual power of TradingView’s premium layouts for free, combined with the ability to execute and manage trades directly inside your active workspace.
Technical Analysis & Tool Integrity Disclosure
This analytical review and comparison are for strictly educational, informational, and market-awareness purposes only. Mention of specific charting platforms, brokers, or technical indicator toolsets does not constitute a financial endorsement, commercial solicitation, or investment advice.
Technical visualization software and mathematical algorithms process historical market data; they do not possess predictive capabilities and cannot guarantee future market behavior, price direction, or trading profitability. Investment in the securities market is subject to market risks. Read all the related documents carefully before investing. Registrations granted by SEBI, membership of BASL, and certification from NISM in no way guarantee performance of the intermediary or provide any assurance of returns to investors.
Also read:
- How to Use Agentic AI in Investment and Trading — A Complete Guide for Indian Investors
- Is Your TCS SIP Safe? 5 Truths About AI and India’s IT Stocks in 2026
- The White Collar Recession Nobody Is Talking About
- How to Start Investing in India as a Beginner (2026 Complete Guide)
This article is for educational purposes only. All projected figures are clearly marked and do not constitute investment advice or a guarantee of future performance. Gyani Turtle is not a SEBI-registered Investment Adviser. No part of this analysis constitutes a buy, sell, or hold recommendation for any specific equity, derivative, REIT, or corporate instrument. All named companies are referenced for macroeconomic illustration only. Please consult independent SEBI-registered financial advisors and legal professionals before making any investment or cross-border asset allocation decisions.
At Gyani Turtle, we believe every Indian deserves access to honest, jargon-free financial education. Our team simplifies investing, mutual funds, and personal finance — so you can build real wealth, one smart decision at a time. Not SEBI registered. For educational purposes only.