
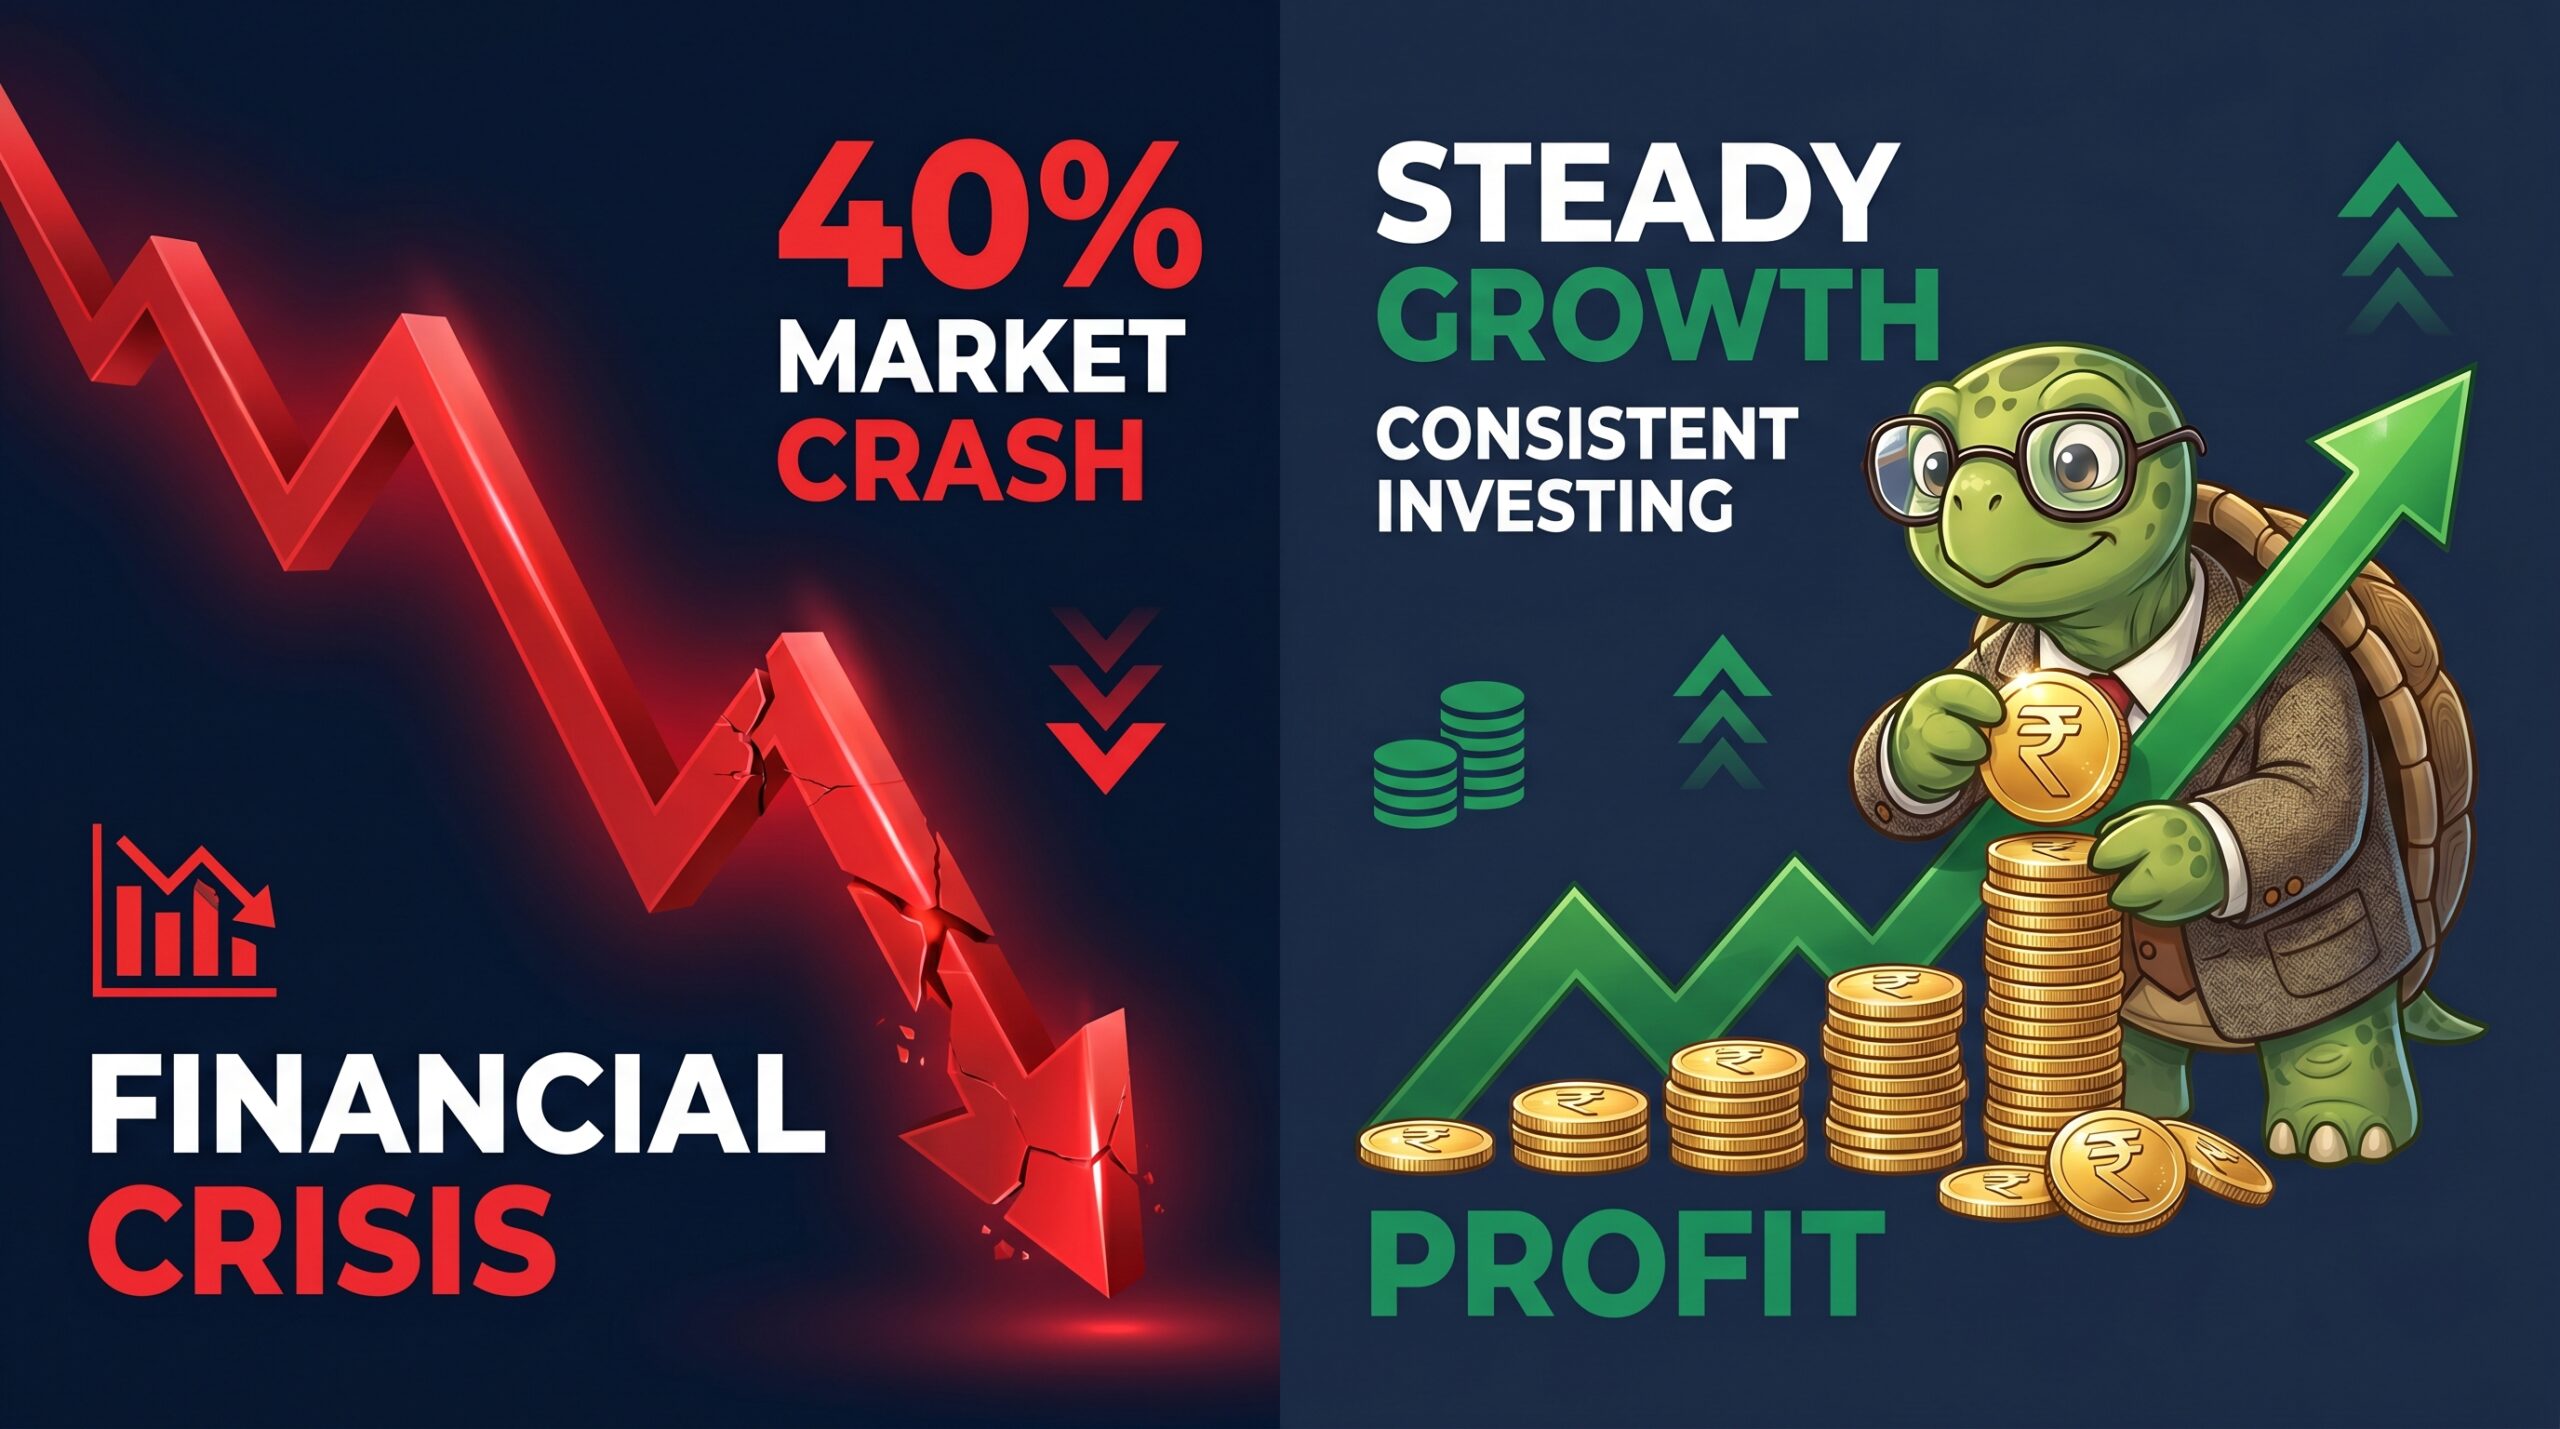
What Happens to SIP If Market Crashes? 40% Crash Data Revealed
When your investment app shows a portfolio down 35% and falling, one button becomes dangerously tempting: Stop SIP.
This article is not going to tell you to stay calm. It is going to show you — with verified historical data from two actual Indian market crashes — exactly what happens to SIP if market crashes, and what the numbers looked like for investors who panicked versus those who held the line.
What Happens to SIP If Market Crashes: The 2 Definitive Data Events
India’s equity markets have survived multiple structural shocks. Two of them stand as the definitive stress tests for SIP investors.
2008: The global financial crisis
The Nifty 50 peaked near 6,357 in January 2008. By October 2008 — in roughly nine to ten months — it had collapsed to approximately 2,253, representing a peak-to-trough drawdown of around 60%. This remains the deepest drawdown the index has ever recorded.
Recovery from the absolute trough took approximately 739 days. The full peak-to-recovery cycle — from the January 2008 high back to reclaiming that level — lasted roughly 1,032 calendar days, completing around November 2010. Investors who stayed invested through the entire period eventually saw the index more than triple from its 2008 lows by 2013.
2020: The COVID-19 flash crash
Speed was the defining feature of the 2020 collapse. From a mid-January peak near 12,431, the Nifty plunged roughly 38–40% to approximately 7,511 in just 46 trading days — one of the fastest crashes on record globally.
The single worst session was March 23, 2020, when the index collapsed approximately 12–13% in a single trading day. Then the recovery was equally extraordinary: by November 2020 — just around 231 days from the trough — the Nifty had reclaimed its pre-COVID peak. By March 2023, it was trading near 17,000, more than 2.3 times the March 2020 low.
(Source: NSE Historical Data · Nifty Drawdown Analysis, INVES 21 · BusinessToday Drawdown Analysis)
What Happens to SIP Returns If Market Crashes — The Actual Numbers
These crashes were not just index events. They were financial stress tests for millions of households running monthly SIPs.
The 2008 cohort: Investors running a Nifty 50 SIP through the GFC saw their 1-year trailing returns plunge to approximately -35.5%. Because the SIP continued acquiring units at collapsing NAVs, historical trailing returns for continuous investors recovered to approximately +29.4% at 3 years and +34.7% at 5 years.
The 2020 cohort: Short-term SIP returns turned sharply negative at the March 2020 bottom. However, for investors who maintained their SIPs through the full drawdown, the 3-year trailing SIP return historically stood at approximately +98.7% by 2023 — nearly doubling the invested capital — because the rupee-cost averaging engine had been accumulating units at the lowest prices seen in years.
(Source: Historical Nifty SIP Dataset, INVES 21, April 2026)
These are historical return figures for illustrative purposes. Past performance is not indicative of future results. Actual returns will vary depending on the specific fund, entry timing, and market conditions at the time of investment.
What AMFI Data Shows About SIP Stoppage When Market Crashes
Raw market data tells one story. Investor behaviour tells another.
The AMFI SIP Stoppage Ratio measures discontinued and matured SIPs against new registrations in any given month. When markets corrected sharply in late 2024 and early 2025, this ratio spiked to its highest levels on record.
In January 2025, the stoppage ratio hit 109.15% — meaning more SIPs were being stopped than were being started. By February 2025, it escalated further to 122.76%, as 54.70 lakh SIPs were discontinued against only 44.56 lakh new registrations.
By February 2026, as markets stabilised, the ratio had normalized to 75.62%, with gross monthly SIP inflows holding at ₹29,845 crore — a 15% increase year-on-year from February 2025. The SIP account base had grown to 10.45 crore accounts with AUM of ₹16.64 lakh crore.
(Source: AMFI Monthly Industry Reports · Value Research Online · Angel One · Finnovate · Bonvista)
The data reveals a structural divide: emotional retail investors exit at the bottom; disciplined investors — and new entrants who see falling markets as opportunity — quietly accumulate.
How the dominoes actually fall: the vicious cycle

Understanding why retail panic happens helps explain why it is so predictable — and so costly.
When a macro shock causes a 40% collapse in Indian equity markets, the economic shockwaves move in a documented sequence:
- The macro trigger. Global liquidity tightens or foreign institutional investors (FIIs) dump Indian equities aggressively, erasing lakhs of crore in market capitalisation within days.
- Corporate capital freeze. Listed companies see valuations collapse. Capital expenditure plans are halted, corporate credit costs spike, and management moves into cash-preservation mode.
- Income stress. To protect balance sheets, corporate India freezes hiring, suspends annual increments, cuts performance bonuses. In severe structural crashes, layoffs follow.
- The consumption squeeze. With frozen salaries and visible portfolio destruction, middle-class confidence collapses. Families defer purchasing decisions across automobiles, housing, and consumer goods.
- Retail financial panic. The investor opens their app, sees a 30–40% paper loss, and presses Stop SIP.
- The permanent opportunity cost. By halting at the bottom, the investor locks themselves out of cheap unit accumulation — mathematically impeding the compounding base that would have driven recovery-phase gains.
Path A vs Path B: What Happens to SIP If You Stop vs Continue
To make the numbers concrete, consider a historical simulation modelled on the 2020 drawdown.
A household in Delhi NCR with a combined monthly income of ₹1,75,000 has been running an equity SIP of ₹20,000 per month for 4 years. Just before a 40% market collapse, their portfolio stands at ₹12,00,000. It craters temporarily to ₹7,20,000.
Path A — the panic trap
Seeing a ₹4,80,000 notional drop, the investor halts the SIP for 12 months to “wait for stability.” The ₹2,40,000 of planned capital sits idle in a savings account while the NAV sits at rock bottom. When markets recover, the investor restarts — having missed the entire low-NAV accumulation window. Hypothetical 5-year post-crash portfolio value: approximately ₹16,50,000.

Path B — disciplined continuation
The investor views the falling NAV as a deep discount and maintains the ₹20,000 monthly SIP without missing a single instalment. The fixed amount mathematically acquires more units as prices fall. When the market recovers, those extra units act as a compounding multiplier. Backtested portfolio value for this scenario: approximately ₹23,10,000.
The difference: ₹6,60,000 — from a single behavioral decision.
This is a historical simulation for educational illustration only. Returns are backtested and not a guarantee of future outcomes. Actual results will vary.
|
Strategy / Asset |
5-Year Historical Return Profile |
Risk Profile |
Indian Tax Treatment |
|---|---|---|---|
|
Continuing equity SIPs |
Strong — rupee-cost averaging maximises unit accumulation at lows |
High short-term volatility; long-term capital risk reduces |
LTCG at 12.5% on gains above ₹1.25 lakh per financial year |
|
Pausing or stopping SIPs |
Weak — misses the low-NAV window; high opportunity cost on re-entry |
High behavioural risk; compounding base impaired |
No immediate tax event, but future returns are sacrificed |
|
Bank Fixed Deposits (FDs) |
Low and rigid (historically 6–7.5%) — often struggles to beat post-tax real inflation |
Zero capital risk; DICGC insurance up to ₹5 lakh |
Interest added to income tax slab, taxed up to 30%+ |
|
Electronic Gold Receipts (EGRs) |
Moderate — structural hedge against rupee depreciation and global equity panic |
Moderate; subject to global commodity pricing and INR fluctuations |
Capital gains taxation based on holding period |
How experienced investors historically positioned themselves
Automation removes emotion
The most consistent observation among financial planners is that salaried investors who set up ECS/auto-debit mandates and stop monitoring daily NAVs tend to outperform those who actively manage their SIP status. Automation removes the human decision point that causes behavioural errors.
MSMEs: survival before opportunity
For business owners, the calculus is different. Establishing a 6–9 month working capital runway takes absolute priority. If liquidity tightens severely, using a mutual fund’s ‘Pause’ feature for 1–2 months — or temporarily reducing the SIP amount by 50% rather than deleting the mandate entirely — preserves the compounding chain while maintaining survival capital.
Institutional rebalancing
When markets fall 40%, a standard 60% equity / 40% debt portfolio tilts dramatically out of balance. Institutional managers respond by systematically selling stable debt positions to buy back into equity — forcing the portfolio back to its 60% target precisely when stocks are cheapest. Some experienced investors deploy a step-up approach: manual 10% top-ups into index funds for every 5% the market falls.
Ring-fence the household first
Historical data consistently shows that investors who navigate crashes successfully maintain strict ring-fencing of their emergency funds — covering 6 months of baseline expenses in liquid assets. They do not use survival capital to buy dips. Temporary market volatility must never threaten household security.
The honest counterargument: when stopping makes sense

The mainstream narrative of “never stop your SIP” has real limitations that deserve acknowledgement.
The survival blind spot. If a retail investor loses primary income or faces a medical emergency during a crash, continuing an equity SIP is not discipline — it is financially destructive. Survival, debt clearance, and cash preservation must always take priority over unit accumulation.
The small-cap deception. Not all mutual funds recover equally. Portfolios heavily skewed toward low-quality small-cap or narrow thematic funds can experience permanent capital impairment. If underlying companies go bankrupt, the NAV may never reclaim previous highs regardless of how long the SIP continues. Fund quality matters.
The prolonged underperformance risk. The expectation of a 12-month V-shaped recovery is driven by recency bias from the 2020 crash. Historical global data shows markets can take up to a decade to structurally recover. Investors must possess genuine psychological endurance to sustain flat or negative returns for 3–5 years before the real wealth creation phase arrives.
What India’s regulators have historically done
The Reserve Bank of India consistently monitors systemic financial stability during market dislocations. In structural drawdowns, the RBI has historically deployed monetary interventions — including targeted long-term repo operations (TLTROs) and system liquidity infusions — to prevent equity market panic from spilling into banking and credit systems.
SEBI enforces stress-testing protocols for mutual fund houses, particularly in mid and small-cap schemes, ensuring sufficient liquidity to manage redemptions without triggering NAV collapse during extreme panic scenarios.
AMFI has historically run counter-cyclical investor education campaigns during deep drawdowns, using its structural data to demonstrate that stopping SIPs during corrections mathematically neutralises the rupee-cost averaging advantage.
The Bottom Line: What Happens to SIP If Market Crashes
Two verified crash events. Two recovery paths. One measurable gap.
The 2008 cohort who maintained their SIPs through a ~60% drawdown saw 5-year trailing returns reach approximately +34.7%. The 2020 cohort who continued through a ~38–40% crash saw 3-year returns historically touch approximately +98.7%.
The AMFI stoppage ratio data from early 2025 confirms that a significant portion of retail investors stopped precisely at the most costly moment — the bottom. By early 2026, the same data shows those who remained are sitting on a substantially different compounding base.
A crash does not destroy SIP wealth. A decision made in thirty seconds — on a falling NAV screen — often does.
This article is for educational purposes only. Historical return figures are backtested and do not constitute investment advice or a guarantee of future performance. Mutual fund investments are subject to market risks. Please read all scheme-related documents carefully and consult a SEBI-registered financial advisor before making any investment decisions.
Also Read:
- SEBI Mutual Fund Stress Test: Is Your Small-Cap Fund a Liquidity Trap?
- How to Use Agentic AI in Investment and Trading — A Complete Guide for Indian Investors
- Large-Cap vs Small-Cap: Why ‘Quality’ Matters in 2026

At Gyani Turtle, we believe every Indian deserves access to honest, jargon-free financial education. Our team simplifies investing, mutual funds, and personal finance — so you can build real wealth, one smart decision at a time. Not SEBI registered. For educational purposes only.